| How to build a phase diagram | page 1 of 6 | |
 |
A binary
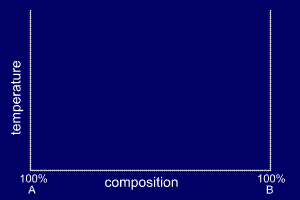
phase diagram shows the phases formed in differing mixtures of two
elements over a range of
temperatures. Compositions run from 100% Element A on the left of the diagram, through all possible mixtures, to 100% Element B on the right. The composition of an alloy is given in the form A - x%B. For example, Cu - 20%Al is 80% copper and 20% aluminium. Weight percentages are
often used to specify the proportions of the alloying
elements, but atomic
percent may be used. The type
of percentage is specified e.g. Weight percentages will be used throughout this text. |
| How to build a phase diagram | page 2 of 6 | |
 |
Alloys tend to solidify over a temperature
range, rather than at a specific
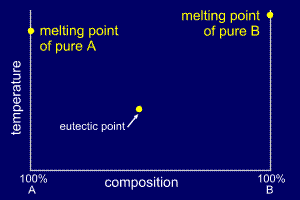
temperature like pure elements. At each end of the phase diagram only one of the elements is present (100% A or 100% B) and therefore a specific melting point exists. Sometimes there is a mixture of the constituent elements which produces solidification at a single temperature like a pure element. This is called the eutectic point. The eutectic point can be found experimentally by plotting cooling rates over ranges of alloy composition. The phase diagrams for some very simple binary alloys do not have eutectic points (more info). |
| How to build a phase diagram | page 3 of 6 | |
 |
By cooling
alloys from the liquid state and recording their cooling
rates, the temperature at which they start to solidify
can be determined and then plotted on the phase diagram.
If enough experiments are performed over a range of
compositions, a start of solidification
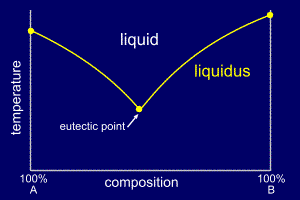
curve can be plotted onto the phase diagram. This curve will join the three single solidification points and is called the liquidus line. |
| How to build a phase diagram | page 4 of 6 | |
 |
In the same
way that sugar dissolves into hot tea (a liquid solution)
it is possible for one element to dissolve in another,
whist both remain inn the solid state. This is called solid
solubility and is
characteristically up to a few percent by
weight. This solubility limit will normally
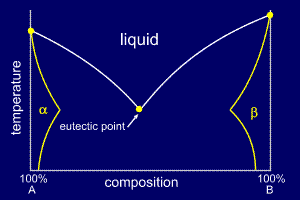
change with temperature. The extent of the solid solubility region can be plotted onto the phase diagram and labelled appropriately. A solid solution of B in A (i.e. mostly A) is called alpha and a solid solution of A in B (i.e. mostly B) is called beta. It is worthwhile to note that some elements that are alloyed have zero solid solubility; a good example is Al - Si alloys, where aluminium has zero solid solubility in silicon. |
| How to build a phase diagram | page 5 of 6 | |
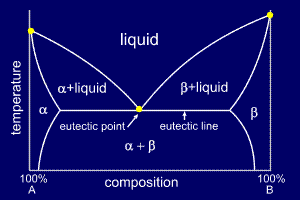 |
If an alloy's
composition does not place it within the small solid
solution regions at either side of the phase diagram, the
alloy will become fully solid at the eutectic
temperature, shown as the eutectic
line on the phase diagram. At alloy compositions and temperatures between the start of solidification and the point at which it becomes fully solid (the eutectic temperature) a mushy mix of either alpha or beta will exist as solid lumps with a liquid mixture of A and B. These partially solid regions are marked on the phase diagram. The region below the eutectic line, and outside the solid solution region, will be a solid mixture of alpha and beta, and is labelled to reflect this. |
| How to build a phase diagram | page 6 of 6 | |
 |
|
| A simple phase diagram | more info | |
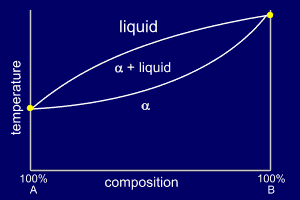 |
Very simple binary phase
diagrams do not have a eutectic point. The liquid mixture
will cool through a solidification region (temperature
range) and become a solid solution of the two constituent
elements. These simple phase diagrams normally only occur when two very similar elements are being alloyed or as part of a more complex phase diagram. |